Overview
I make a lot of plots, and the fragmentation of tools in this space really
bugs me. People writing Python code mostly use matplotlib, R people use
ggplot2. MS people use the internal Excel thing. I've seen people use
gtkdatabox for GTK widgets, rrdtool for logging, qcustomplot for qt. And
so on. This is really unhelpful, and it would benefit everybody if there was a
single solid plotting backend with lots of bindings to different languages and
tools.
For my own usage, I've been fighting this quixotic battle, using gnuplot as
the plotting backend for all my use cases. gnuplot is
- very mature
- stable
- fast
- powerful
- supported on every (with reason) platform
- supports lots and lots of output backends
There are some things it can't do, but those can be added, and I haven't felt it to be limiting in over 20 years of using it.
I rarely use it directly, and usually interact with it through one of
feedgnuplotfor console usegnuplotlibfor programmatic use from Python- PDL::Graphics::Gnuplot for programmatic use from Perl
I wrote all of these, although the Perl library was taken over by others long ago.
Recently I needed a plotting widget for an FLTK program written in Python. It
would be great if there was a C++ class deriving from Fl_Widget that would be
wrapped by pyfltk, but there isn't.
But it turns out that I already had all the tools to quickly hack together something that mostly works. This is a not-ready-for-primetime hack, but it works so well, I'd like to write it up. Hopefully this will be done "properly" someday.
Approach
Alright. So here I'm trying to tie together a Python program, gnuplot output
and an FLTK widget. This is a Python program, I can use gnuplotlib to talk
to the gnuplot backend. In a perfect world, gnuplot would ship a backend
interfacing to FLTK. But it doesn't. What it does do is to ship an x11
backend that makes plots with X11 commands, and it allows these commands to be
directed to an arbitrary X11 window. So we
- Make an
FLTKwidget that simply creates an X11 window, and never actually draws into it - Tell
gnuplotto plot into this window
Demo
This is really simple, and works shockingly well. Here's my Fl_gnuplotlib
widget:
#!/usr/bin/python3

import sys
import gnuplotlib as gp
import fltk

class Fl_Gnuplotlib_Window(fltk.Fl_Window):

    def __init__(self, x,y,w,h, **plot_options):
        super().__init__(x,y,w,h)
        self.end()

        self._plot                 = None
        self._delayed_plot_options = None

        self.init_plot(**plot_options)

    def init_plot(self, **plot_options):
        if 'terminal' in plot_options:
            raise Exception("Fl_Gnuplotlib_Window needs control of the terminal, but the user asked for a specific 'terminal'")

        if self._plot is not None:
            self._plot = None

        self._delayed_plot_options = None

        xid = fltk.fl_xid(self)
        if xid == 0:
            # I don't have an xid (yet?), so I delay the init
            self._delayed_plot_options = plot_options
            return

        # will barf if we already have a terminal
        gp.add_plot_option(plot_options,
                           terminal = f'x11 window "0x{xid:x}"')

        self._plot = gp.gnuplotlib(**plot_options)

    def plot(self, *args, **kwargs):

        if self._plot is None:
            if self._delayed_plot_options is None:
                raise Exception("plot has not been initialized")

            self.init_plot(**self._delayed_plot_options)
            if self._plot is None:
                raise Exception("plot has not been initialized. Delayed initialization failed")

        self._plot.plot(*args, **kwargs)
Clearly it's simply making an Fl_Window, and pointing gnuplotlib at it. And
a sample application that uses this widget:
#!/usr/bin/python3

import sys
import numpy as np
import numpysane as nps
from fltk import *
from Fl_gnuplotlib import *


window = Fl_Window(800, 600, "plot")
plot   = Fl_Gnuplotlib_Window(0, 0, 800,600)


iplot = 0
plotx = np.arange(1000)
ploty = nps.cat(plotx*plotx,
                np.sin(plotx/100),
                plotx)

def timer_callback(*args):

    global iplot, plotx, ploty, plot
    plot.plot(plotx,
              ploty[iplot],
              _with = 'lines')

    iplot += 1
    if iplot == len(ploty):
        iplot = 0

    Fl.repeat_timeout(1.0, timer_callback)


window.resizable(window)
window.end()
window.show()

Fl.add_timeout(1.0, timer_callback)

Fl.run()
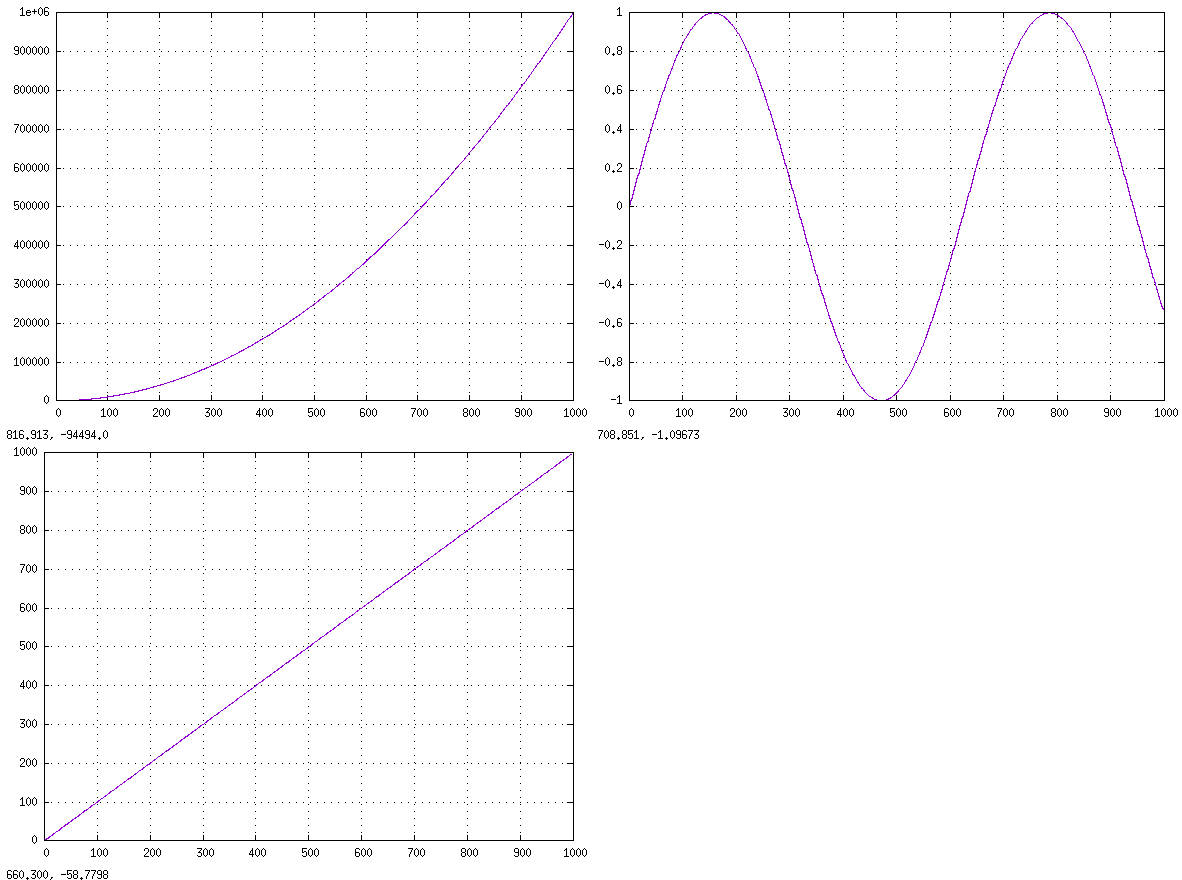
This is nice and simple. Exactly what a program using a widget to make a plot (while being oblivious to the details) should look like. It creates a window, places the one plotting widget into it, and cycles the plot inside it at 1Hz (cycling between a parabola, a sinusoid and a line). Clearly we could place other UI elements around it, or add more plots, or whatever.
The output looks like this:

To run you need to apt install python3-numpysane python3-gnuplotlib
python3-fltk. If running an older distro on a non-Debian-based distro, you
should grab those from source.
Discussion
This works. But it's a hack. Some issues:
- This plotting widget currently can output only. It can make whatever plot we like, but it cannot accept UI input from the container program in any way
- More than that, when focused it completely replaces the FLTK event logic for that window. So all keyboard input is swallowed, including the keys to access FLTK menus, to exit the application, etc, etc.
- This approach requires us to use the
x11gnuplot terminal. This works, but it's no longer the terminal preferred by thegnuplotdevs, and it it's maintained as vigilantly as the others. - And it has bugs. For instance, asking to plot into a window that doesn't yet exist, causes it to create a new window. This breaks FLTK applications that start up and create a plot immediately. Here's a mailing list thread discussing these issues.
So this is a very functional hack, but it's still hack. And it feels like making this solid will take a lot of work. Maybe. I'll push more on this as I need it. Stay tuned!