I was asked by a client to investigate an issue they observed where the
performance of some hardware became dramatically degraded after a kernel update
on the server this hardware was connected to. This device is an external unit
that communicates with the server using an FTDI usb-serial converter. The
program running on the server that talks to this device is a proprietary binary
blob I'll call the frobnicator. This blob came from some vendor, and the
client did not have access to sources, or had any real idea about how this
frobnicator communicates or what it expects.
For years they were using a stock Linux 3.5 kernel shipped by Ubuntu with no issues. But upgrading to a stock 3.13 kernel was apparently causing the device to exhibit glitches, and generally misbehave.
Initial investigation
When asked to look into this, I first manipulated the server in various ways to see how the issue manifests, and what triggers it. I could see that
- The
frobnicatorreports communication integrity (CI) values, and those were noticeably reduced on the newer kernel, which would explain the degraded performance - Raising the system CPU load correlated with higher CI degradation, so a loose
theory could be resource contention, where other tasks are taking resources
away from the
frobnicator - periodically, errors would appear in the frobnicator log file
/var/log/frobnicator.log, and these corresponded with periods of poor performance
Now that there was a concrete event that coincided with the poor performance, this could be traced with a tool such as sysdig. The hope was that one would see what happened leading up to the reported error, and investigate that. So; first I recorded a log
$ sudo sysdig -w frobnicator.scap proc.name = frobnicator
Then found instances where it writes complaints into its log:
$ sysdig -r frobnicator.scap fd.name contains frobnicator.log

371858 12:01:43.587694261 0 frobnicator (21343) < open fd=10(<f>/var/log/frobnicator.log) name=frobnicator.log(/var/log/frobnicator.log) flags=15(O_APPEND|O_CREAT|O_RDWR) mode=0
371859 12:01:43.587713415 0 frobnicator (21343) > fstat fd=10(<f>/var/log/frobnicator.log)
371860 12:01:43.587714435 0 frobnicator (21343) < fstat res=0
371863 12:01:43.587748893 0 frobnicator (21343) > write fd=10(<f>/var/log/frobnicator.log) size=50
371864 12:01:43.587779337 0 frobnicator (21343) < write res=51 data=[254542.588] ERROR! OH NO! COULDN'T COMMUNICATE!!!
371865 12:01:43.587780740 0 frobnicator (21343) > close fd=10(<f>/var/log/frobnicator.log)
371866 12:01:43.587781852 0 frobnicator (21343) < close res=0
371872 12:01:43.587824754 0 frobnicator (21343) < open fd=10(<f>/var/log/frobnicator.log) name=frobnicator.log(/var/log/frobnicator.log) flags=15(O_APPEND|O_CREAT|O_RDWR) mode=0
371873 12:01:43.587831903 0 frobnicator (21343) > fstat fd=10(<f>/var/log/frobnicator.log)
371874 12:01:43.587832417 0 frobnicator (21343) < fstat res=0
371877 12:01:43.587838779 0 frobnicator (21343) > write fd=10(<f>/var/log/frobnicator.log) size=48
371878 12:01:43.587843915 0 frobnicator (21343) < write res=40 data=[254542.588] NOOO!! SOMETHING ELSE WENT WRONG!!!
371879 12:01:43.587844635 0 frobnicator (21343) > close fd=10(<f>/var/log/frobnicator.log)
371880 12:01:43.587845018 0 frobnicator (21343) < close res=0
And then looked at what happened leading up to it, searching for anything noteworthy:
$ sysdig -r frobnicator.scap evt.num \>= $((371858-10000)) and evt.num \<= 371858

...
365555 12:01:43.584116007 0 frobnicator (21343) > write fd=7(<f>/dev/ttyUSB2) size=7
365556 12:01:43.584120946 0 frobnicator (21343) < write res=7 data=.......
365557 12:01:43.584121497 0 frobnicator (21343) > fcntl fd=7(<f>/dev/ttyUSB2) cmd=5(F_SETFL)
365558 12:01:43.584121792 0 frobnicator (21343) < fcntl res=0(<f>/dev/pts/3)
365559 12:01:43.584123089 0 frobnicator (21343) > read fd=7(<f>/dev/ttyUSB2) size=32767
365560 12:01:43.584124530 0 frobnicator (21343) < read res=0 data=
365561 12:01:43.584125440 0 frobnicator (21343) > read fd=7(<f>/dev/ttyUSB2) size=32767
365562 12:01:43.584125967 0 frobnicator (21343) < read res=0 data=
365563 12:01:43.584126441 0 frobnicator (21343) > read fd=7(<f>/dev/ttyUSB2) size=32767
365564 12:01:43.584126830 0 frobnicator (21343) < read res=0 data=
..... lots more hammering read() that returns 0
371853 12:01:43.587643084 0 frobnicator (21343) > read fd=7(<f>/dev/ttyUSB2) size=32767
371854 12:01:43.587643466 0 frobnicator (21343) < read res=0 data=
371855 12:01:43.587651900 0 frobnicator (21343) > stat
371856 12:01:43.587660887 0 frobnicator (21343) < stat res=0 path=frobnicator.log(/var/log/frobnicator.log)
371857 12:01:43.587665751 0 frobnicator (21343) > open
371858 12:01:43.587694261 0 frobnicator (21343) < open fd=10(<f>/var/log/frobnicator.log) name=frobnicator.log(/var/log/frobnicator.log) flags=15(O_APPEND|O_CREAT|O_RDWR) mode=0
So we wrote something to the device at /dev/ttyUSB2, then hammered the port
waiting for a reply, then gave up reading the port without getting any data, and
complained into the log. (This hammering is embarrassing. Apparently the authors
of frobnicator have never heard of select or poll. This yet again supports
my theory that most proprietary software is proprietary not to protect some
brilliant IP from theft, but rather to avoid embarrassment). So presumably some
timeout expired; the frobnicator likely expected to get a reply from the
hardware before a certain amount of time elapsed, and this took too long. How
long did it take?
$ echo $((.587651900 - .584120946))
0.0035309540000000306
So after about 3.5ms, we gave up. The serial device is set at 115200 baud. Let's say you need 10-bits-worth of time to transmit a single byte (this is about right probably because of the start and stop bits). To write 7 bytes and get at least 1 byte back you need
$ echo $(( 8.*10/115200 ))
0.00069444444444444447
0.7ms just for the communication. So I guess it's not crazy to want a reply within 3.5ms. Presumably it doesn't fail this way every time? Do we ever read anything from USB2? Under what circumstances?
$ sysdig -r frobnicator.scap evt.type = read and fd.name contains USB2 and evt.rawres \!= 0 | head -n 10

10190 12:01:41.803108311 1 frobnicator (21343) < read res=1 data=.
16753 12:01:41.834119153 1 frobnicator (21343) < read res=1 data=.
23252 12:01:41.865108212 1 frobnicator (21343) < read res=1 data=.
29817 12:01:41.896112925 1 frobnicator (21343) < read res=1 data=.
42142 12:01:41.959126061 1 frobnicator (21343) < read res=1 data=.
46319 12:01:41.989105762 1 frobnicator (21343) < read res=1 data=.
52241 12:01:42.020106289 3 frobnicator (21343) < read res=1 data=.
58206 12:01:42.051112845 3 frobnicator (21343) < read res=1 data=.
64759 12:01:42.082126350 3 frobnicator (21343) < read res=1 data=.
71562 12:01:42.113106478 3 frobnicator (21343) < read res=1 data=.


$ sysdig -r frobnicator.scap evt.type = write and fd.name contains USB2 and evt.num \< 42142 | tail -n1

37288 12:01:41.957115614 1 frobnicator (21343) < write res=7 data=.......


$ sysdig -r frobnicator.scap evt.num \>= 37288 and evt.num \<= 42142

37288 12:01:41.957115614 1 frobnicator (21343) < write res=7 data=.......
37289 12:01:41.957116233 1 frobnicator (21343) > fcntl fd=7(<f>/dev/ttyUSB2) cmd=5(F_SETFL)
37290 12:01:41.957116440 1 frobnicator (21343) < fcntl res=0(<f>/dev/pts/3)
37291 12:01:41.957117828 1 frobnicator (21343) > read fd=7(<f>/dev/ttyUSB2) size=32767
37292 12:01:41.957118640 1 frobnicator (21343) < read res=0 data=
37293 12:01:41.957119433 1 frobnicator (21343) > read fd=7(<f>/dev/ttyUSB2) size=32767
37294 12:01:41.957119972 1 frobnicator (21343) < read res=0 data=
37295 12:01:41.957120373 1 frobnicator (21343) > read fd=7(<f>/dev/ttyUSB2) size=32767
37296 12:01:41.957120901 1 frobnicator (21343) < read res=0 data=
... again. we hammer the read()
42133 12:01:41.959120974 1 frobnicator (21343) > read fd=7(<f>/dev/ttyUSB2) size=32767
42134 12:01:41.959121368 1 frobnicator (21343) < read res=0 data=
42135 12:01:41.959121769 1 frobnicator (21343) > read fd=7(<f>/dev/ttyUSB2) size=32767
42136 12:01:41.959122160 1 frobnicator (21343) < read res=0 data=
42137 12:01:41.959122719 1 frobnicator (21343) > read fd=7(<f>/dev/ttyUSB2) size=32767
42138 12:01:41.959123119 1 frobnicator (21343) < read res=0 data=
42139 12:01:41.959123690 1 frobnicator (21343) > read fd=7(<f>/dev/ttyUSB2) size=32767
42140 12:01:41.959124311 1 frobnicator (21343) < read res=0 data=
42141 12:01:41.959124846 1 frobnicator (21343) > read fd=7(<f>/dev/ttyUSB2) size=32767
42142 12:01:41.959126061 1 frobnicator (21343) < read res=1 data=.
So that time, we wrote to /dev/ttyUSB2, but did receive a response of exactly
one byte. The delay there was
$ echo $((.959126061 - .957115614 ))
0.0020104469999999708
about 2ms. OK. That's reasonable too. So it very well could be that we complain if the response comes after 3.5ms. What's the distribution of these response times?
$ sysdig -t r -r frobnicator.scap fd.name contains frobnicator.log or \
  \( fd.name contains ttyUSB2 and \
    \( \( evt.type = read and evt.dir = '<' and evt.rawres \!= 0\) or \
       \( evt.type = write and evt.dir = '>' \) \) \) | \
  perl -anE 'if(/write.*USB2/) { $t0 = $F[1]; }
             elsif(defined $t0 && /read|frobnicator.log/ ) { $d = $F[1] - $t0; say $d*1000; $t0 = undef; }' | \
  feedgnuplot --histo 0 --binwidth 0.1 --with boxes --set 'style fill solid border -1' \
              --title "Histogram of /dev/ttyUSB2 reply times" --xlabel "Reply (ms)" -ylabel Count
OK, so we look at the time interval between a write() to /dev/ttyUSB2 and
either when we read() something from it, or touch frobnicator.log in any way.
Looks like the usual time is 1.5ms or so, and we give up at 3.5ms, as expected:

I did the same thing on a working machine running the known-good 3.5 kernel: no
frobnicator.log error messages were observed and a response histogram made
this way is clean, and does not ever break 3.5ms. So this is consistent with the
theory that these 3.5ms timeouts are involved in the poor performance we are
seeing.
I should say that we are running vanilla Linux kernel from Ubuntu. It appears
that the frobnicator is expecting realtime performance from this kernel, but
this realtime performance was never guaranteed. So it's unlikely that the
kernel is doing anything more "wrong" now than it was before, and the
frobnicator just has unreasonable expectations. Anyway…
Initial kernel tracing
We see that an expected response from the USB device does not arrive, or arrives
too late. Many things could be causing this. I was hoping this is purely a
software issue, so I dug into the kernel. This isn't something that sysdig can
do, so I switched to perf here. I placed lots of probes into the path from the
time when we write() to /dev/ttyUSB2 to the time when we either receive a
response or give up. Eventually I ended up with this recordall script:
#!/bin/bash

set -e

VMLINUX=/usr/lib/debug/boot/vmlinux-3.13.0-58-generic
USBSERIALDIR=/usr/lib/debug/lib/modules/3.13.0-58-generic/kernel/drivers/usb/serial
USBSERIAL=$USBSERIALDIR/usbserial.ko
FTDI=$USBSERIALDIR/ftdi_sio.ko
SOURCE=/chattel/linux

sudo perf probe --del '*' || true # let this fail

sudo perf probe -k $VMLINUX -s $SOURCE -m $FTDI      --add 'ftdi_process_read_urb urb->actual_length urb->status urb->transfer_buffer_length'
sudo perf probe -k $VMLINUX -s $SOURCE -m $FTDI      --add 'ftdi_process_packet len'
sudo perf probe -k $VMLINUX -s $SOURCE               --add 'tty_insert_flip_string_fixed_flag flag size'
sudo perf probe -k $VMLINUX -s $SOURCE               --add 'tty_schedule_flip'
sudo perf probe -k $VMLINUX -s $SOURCE               --add 'tty_schedule_flip_ret=tty_schedule_flip:6 %ax'
sudo perf probe -k $VMLINUX -s $SOURCE               --add 'flush_to_ldisc'
sudo perf probe -k $VMLINUX -s $SOURCE               --add 'receive_buf'
sudo perf probe -k $VMLINUX -s $SOURCE               --add 'n_tty_receive_buf2'
sudo perf probe -k $VMLINUX -s $SOURCE               --add 'n_tty_receive_buf_common'
sudo perf probe -k $VMLINUX -s $SOURCE               --add 'copy_from_read_buf'
sudo perf probe -k $VMLINUX -s $SOURCE               --add tty_flush_to_ldisc


sudo perf record \
     -esched:sched_{kthread_stop,kthread_stop_ret,wakeup,wakeup_new,switch,migrate_task,process_free,process_exit,wait_task,process_wait,process_fork,process_exec,stat_wait,stat_sleep,stat_iowait,stat_blocked,stat_runtime,pi_setprio,process_hang} \
     -eirq:irq_handler_{entry,exit} \
     -eirq:softirq_{entry,exit} \
     -e cs \
     -e syscalls:sys_enter_write --filter "fd==7" \
     -e syscalls:sys_enter_read  --filter "fd==7" \
     -e syscalls:sys_enter_ppoll \
     -e syscalls:sys_exit_ppoll \
     -e syscalls:sys_exit_read  --filter "ret==0 || ret==1" \
     -eprobe:ftdi_process_read_urb \
     -eprobe:ftdi_process_packet \
     -eprobe:tty_insert_flip_string_fixed_flag \
     -eprobe:tty_schedule_flip{,_ret} \
     -eprobe:copy_from_read_buf \
     -eprobe:{flush_to_ldisc,receive_buf{,_1}} \
     -eprobe:n_tty_receive_buf{2,_common} \
     -eprobe:tty_flush_to_ldisc \
     -eworkqueue:workqueue_{queue_work,activate_work,execute_start,execute_end} \
     -Ra sleep 1; sudo chown user:user perf.data

perf script | ./script_filter.pl > /tmp/`uname -n`.fg
This assumes that kernel debug symbols are available, which is one area where
Ubuntu is actually better than Debian:
https://wiki.ubuntu.com/Debug%20Symbol%20Packages. Note that the probes look at
read() and write(), some USB stuff, some TTY stuff and some process scheduling
stuff. I was adding probes one at a time as I was chasing the failure, and this
is what was there at the end; I didn't just decided to probe this set of things
from the start. After we set up the dynamic tracepoints with perf probe, we
record 1 second of trace data with perf record; this writes a binary
perf.data file, that can be read by perf report (to get statistics) and
perf script (to look at each individual trace).
Once we have a trace, a visualization script is used to convert it into
something that feedgnuplot can visualize. Modulo small visualization tweaks,
script_filter.pl looks like this:
#!/usr/bin/perl

use warnings;
use feature ':5.10';


$i = 0;
my $machine = `uname -n`;
chomp $machine;
say "#!/usr/bin/feedgnuplot --dom --datai --auto --with 'points ps 2' --style cpu 'with labels' --rangesize cpu 2 --set 'key Left'";

my $arg = $ARGV[0];
$print_orig_if = qr/$arg/ if defined $arg;

while(<STDIN>)
{
    chomp;

    next unless /^ /;

    my @F = split;
    ($proc,$cpu,$t,$id, $arg) = @F[0,2,3,4,5];
    $cpu =~ s/\[(.*?)\]/$1/g; $cpu = 0 + $cpu;
    $id =~ s/probe//;
    $id =~ s/syscalls://;
    $id =~ s/workqueue://;
    $id =~ s/irq://;
    $id =~ s/sched://;
    $id =~ s/://g;
    $t =~ s/://g;

    next if $id =~ /^sys_/ && $proc ne 'frobnicator';

    # id mangling
    if ( $id eq 'sys_exit_read' )
    {
        $id .= ";ret=$arg";
    }

    my ($post) = /$id(.*)/;
    if ($post)
    {
        my @args = $post =~ /[0-9a-zA-Z_]+ *= *[0-9a-zx\.]+/g;
        for my $arg (@args)
        {
            $arg =~ s/[ \.]//g;
            $id .= ";$arg";
        }
    }


    if ( $id eq 'sys_exit_read;ret=0x0' && $proc eq 'frobnicator')
    {
        if ($last_exit_read_0)
        { $t0 = undef; }
        else
        { $last_exit_read_0 = 1; }
    }
    elsif ( $id !~ /n_tty_read|r49|tty_put_user|read_/ and $proc eq 'frobnicator')
    {
        $last_exit_read_0 = 0;
    }

    if (/sys_enter_write.*count: [0x]*7$/)
    {
        $t0 = $t;
        $i++;
    }

    if ( defined $t0 )
    {
        $d = ($t-$t0) / 1e-3;

        if( $id !~ /^ftdi|tty|workqueue_queue_work|workqueue_activate_work|irq/ && $proc !~ /frobnicator|swapper/ )
        {
            $id .= ";proc=$proc";
        }

        say "$i $id $d";

        my $icpu = $i + 0.1 + $cpu/50;
        $cpu .= ";$proc" if $id =~/actual_length=3/;
        say "$icpu cpu $d $cpu";

        say STDERR "processed: '$i(t0=$t0) $id $d', orig line: $_" if (defined $print_orig_if && $id =~ $print_orig_if);
    }

    if( $id eq 'sys_exit_read;ret=0x1' && $proc eq 'frobnicator')
    {
        $t0 = undef;
    }
}
This isn't nicely written at all; it's just a one-off made for this
investigation, and is a one-liner that got out of hand. The tracing procedure
was to run ./recordall on a machine while it's exhibiting the troublesome
behavior, then execute the self-plotting data file it creates:
/tmp/MACHINE.fg. Initially, the results look like this:
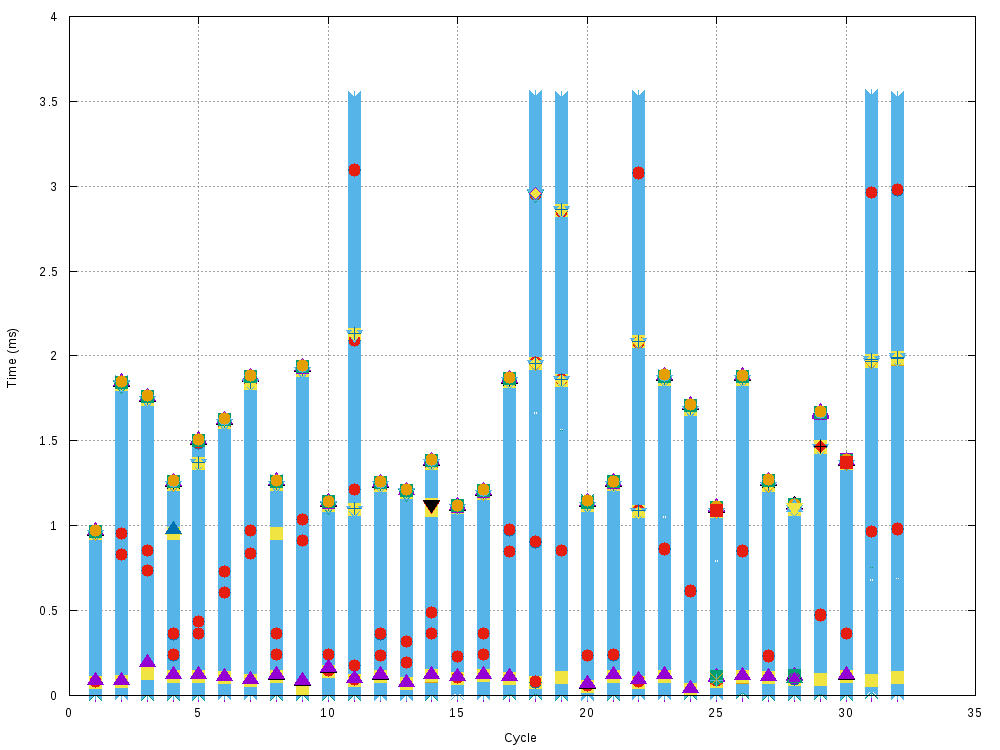
(raster plot because of a very high point count). The x-axis is each attempt
to write to /dev/ttyUSB2 and to get a response from it. The y-axis is time, in
ms. The initial write(/dev/ttyUSB2) is at t=0, at the bottom of each stack.
Each type of event is plotted with a different symbol. Here I omit the legend
because there're way too many different symbols, and too much stuff going on.
Each sequence ends when we either received data from /dev/ttyUSB2 or if we
gave up. Giving up means we stop calling read() on the port. Even with this
super busy plot we see that most cycles complete after 1-2ms, with a few ending
a bit after 3.5ms, as we have seen previously. These cycles are the problem. The
plot looks like a solid wall of events primarily because of the hammering read()
that's happening: we constantly try to read() the data, and get 0 bytes back.
Much more can be inferred if we focus on various sections of this data.
If we make the same plot, but focus only on the FTDI stuff, we get this:

OK. Much less going on. FTDI USB packets are supposed to come in every 1ms, and
we can see this: ftdi_process_read_urb runs in response to the USB interrupt,
and we see stuff happen every 1ms or so. Each FTDI USB packet is supposed to
contain 2 bytes of status, followed by a payload. Thus to get our 1-byte payload
into read(), we must get a USB packet that's 3 bytes long. The great news here
is that we consistently see 3-byte FTDI payloads come in when they're supposed
to, even on cycles where the 3.5ms deadline was missed. For instance, the plot
above showed that cycles 11, 18 and 19 each missed the 3.5ms deadline, but in
this plot we see a 3-byte FTDI packet (blue star, orange square) arrive in time
(at about 2.1ms, 1.95ms and 1.9ms respectively). This means that the hardware
is receiving the data in time, so no need to check the write() latencies,
think about buffering issues, or trace stuff in hardware. Whew. Let's see what
success looks like. If we zoom in on the end of the first stack, we get this:

Here I show the events and which CPU they were executing on. Again, it took a
while to settle on this particular data to plot. As before, we see that the
application repeatedly calls read() which returns with 0: it's asking for data
we do not yet have. In the meantime, we see the 3-byte FTDI packet come in
(ftdi_process_read_urb with actual_length=3). This results in calls to
various functions, eventually making it to the TTY subsystem:
tty_insert_flip_string_fixed_flag. We tty_schedule_flip for later
processing; this calls workqueue_queue_work and workqueue_activate_work.
Then after a bit of time we see this deferred task run:
workqueue_execute_start runs with the payload function: flush_to_ldisc. This
does more stuff, and eventually we see read() return 1. To clarify, the
corresponding raw events coming out of perf script are:
    swapper     0 [000] 93115.013218: probe:ftdi_process_read_urb: (ffffffffa05868c0) actual_length=3 status=0 transfer_buffer_length=200
    swapper     0 [000] 93115.013219: probe:ftdi_process_packet: (ffffffffa05865a0) len=3
    swapper     0 [000] 93115.013220: probe:tty_insert_flip_string_fixed_flag: (ffffffff814723a0) flag=0 size=1
    swapper     0 [000] 93115.013221: probe:tty_schedule_flip: (ffffffff81472090)
    swapper     0 [000] 93115.013222: workqueue:workqueue_queue_work: work struct=0xffff88081e452810 function=flush_to_ldisc workqueue=0xffff88082ec0ac00 req_cpu=256 cpu=0
    swapper     0 [000] 93115.013223: workqueue:workqueue_activate_work: work struct 0xffff88081e452810
    swapper     0 [000] 93115.013227: probe:tty_schedule_flip_ret: (ffffffff814720bb) arg1=1
kworker/0:1   142 [000] 93115.013234: workqueue:workqueue_execute_start: work struct 0xffff88081e452810: function flush_to_ldisc
kworker/0:1   142 [000] 93115.013235: probe:flush_to_ldisc: (ffffffff81472500)
kworker/0:1   142 [000] 93115.013236: probe:receive_buf: (ffffffff814725b0)
kworker/0:1   142 [000] 93115.013237: probe:n_tty_receive_buf2: (ffffffff8146efa0)
kworker/0:1   142 [000] 93115.013238: probe:n_tty_receive_buf_common: (ffffffff8146edc0)
kworker/0:1   142 [000] 93115.013239: workqueue:workqueue_execute_end: work struct 0xffff88081e452810

frobnicator 24483 [001] 93115.013238: syscalls:sys_enter_read: fd: 0x00000007, buf: 0x01f417c4, count: 0x00007fff
frobnicator 24483 [001] 93115.013240: probe:copy_from_read_buf: (ffffffff8146c1f0)
frobnicator 24483 [001] 93115.013241: probe:copy_from_read_buf: (ffffffff8146c1f0)
frobnicator 24483 [001] 93115.013242: syscalls:sys_exit_read: 0x1
That makes sense. What about a failing case? Previously we saw cycle 11 time out at 3.5ms. We do see a 3-byte USB packet arrive, so what's different about the sequence in cycle 11 that makes things break, compared to cycle 1 where things work? The events look like this:

This generally looks similar to what we saw before. The difference is that while
the deferred task is scheduled by workqueue_queue_work and
workqueue_activate_work, it does not run in time. This is very consistent in
all the traces I've been looking at, and we have found our failure mechanism.
CPU allocation and the scheduler
Now that we know that process scheduling is somehow responsible, let's look at the success and failure plots again, and pay attention to what the scheduler is doing and what the various CPUs are doing.
In the success shown above, we see that on CPU 1 frobnicator is doing its
hammering read(), again and again. In the meantime, CPU 0 is servicing an
interrupt:
- IRQ 16 fires. It's apparently handling both USB (ehci) and ethernet (eth0).
- Both of these are handled
- then the USB is further processed by the soft IRQ handler, which (eventually)
calls
ftdi_process_read_urb. The events indicate that the swapper process is what CPU 0 was doing before it was interrupted. This is an internal kernel idle process: i.e. the CPU was not doing anything. - As before we see the scheduling of the deferred task:
workqueue_activate_work. - When this task is scheduled we see some scheduler events:
sched_stat_sleepandsched_wakeup - Then the soft IRQ handler exits, and the scheduler runs to decide what CPU 0
should do next; we see more scheduler events:
sched_stat_waitandsched_switch - The scheduler makes the deferred task run:
workqueue_execute_startin thekworker/0:1kernel process. The0in the process name means CPU 0, so the CPU handling the interrupt is the same as the CPU handling the deferred task. I see this consistently even as I change the CPU servicing the interrupt
The raw events for CPU 0 corresponding to the successful task switch are:
    swapper     0 [000] 93115.013222: workqueue:workqueue_queue_work: work struct=0xffff88081e452810 function=flush_to_ldisc workqueue=0xffff88082ec0ac00 req_cpu=256 cpu=0
    swapper     0 [000] 93115.013223: workqueue:workqueue_activate_work: work struct 0xffff88081e452810
    swapper     0 [000] 93115.013224: sched:sched_stat_sleep: comm=kworker/0:1 pid=142 delay=865313 [ns]
    swapper     0 [000] 93115.013225: sched:sched_wakeup: comm=kworker/0:1 pid=142 prio=120 success=1 target_cpu=000
    swapper     0 [000] 93115.013227: probe:tty_schedule_flip_ret: (ffffffff814720bb) arg1=1
    swapper     0 [000] 93115.013229: irq:softirq_exit: vec=6 [action=TASKLET]
    swapper     0 [000] 93115.013231: sched:sched_stat_wait: comm=kworker/0:1 pid=142 delay=0 [ns]
    swapper     0 [000] 93115.013232: sched:sched_switch: prev_comm=swapper/0 prev_pid=0 prev_prio=120 prev_state=R ==> next_comm=kworker/0:1 next_pid=142 next_prio=120
kworker/0:1   142 [000] 93115.013234: workqueue:workqueue_execute_start: work struct 0xffff88081e452810: function flush_to_ldisc
sched_stat_wait says delay=0 meaning that the kworker/0:1 tasks did not
wait at all to be scheduled. As soon as it was ready to run, it was allowed to.
Great.
OK. What about the failure case? The raw events look like this:
frobnicator 24483 [002] 93115.322925: syscalls:sys_enter_write: fd: 0x00000007, buf: 0x01f15cf4, count: 0x00000007
       ...
       perf 27484 [000] 93115.324019: workqueue:workqueue_queue_work: work struct=0xffff88081e452810 function=flush_to_ldisc workqueue=0xffff88082ec0ac00 req_cpu=256 cpu=0
       perf 27484 [000] 93115.324020: workqueue:workqueue_activate_work: work struct 0xffff88081e452810
       perf 27484 [000] 93115.324022: sched:sched_stat_sleep: comm=kworker/0:1 pid=142 delay=992381 [ns]
       perf 27484 [000] 93115.324023: sched:sched_wakeup: comm=kworker/0:1 pid=142 prio=120 success=1 target_cpu=000
       perf 27484 [000] 93115.324024: probe:tty_schedule_flip_ret: (ffffffff814720bb) arg1=1
       perf 27484 [000] 93115.324027: irq:softirq_exit: vec=6 [action=TASKLET]

       ... CPU 0 services the USB interrupt many more times. None of the scheduled tasks run until...

       perf 27484 [000] 93115.326706: sched:sched_stat_runtime: comm=perf pid=27484 runtime=2856449 [ns] vruntime=482196990 [ns]
       perf 27484 [000] 93115.326708: sched:sched_stat_wait: comm=kworker/0:1 pid=142 delay=2683863 [ns]
       perf 27484 [000] 93115.326709: sched:sched_switch: prev_comm=perf prev_pid=27484 prev_prio=120 prev_state=S ==> next_comm=kworker/0:1 next_pid=142 next_prio=120
       perf 27484 [000] 93115.326710: cs:  ffffffff8176300a [unknown] ([kernel.kallsyms])
kworker/0:1   142 [000] 93115.326712: workqueue:workqueue_execute_start: work struct 0xffff88081e452810: function flush_to_ldisc
That time the hammering read() is on CPU 2 and once again the interrupt is
serviced by CPU 0. When it was interrupted, CPU 0 was not idle, however: it was
running the perf process (used to gather the data we're looking at). Here, the
deferred scheduling happens as in the successful case; we see sched_stat_sleep
and sched_wakeup, but the scheduled process doesn't run, at least not
immediately.
It is significant that the CPU being interrupted was idle in the successful
case: it had nothing else to do other than to service our interrupt. Here it
did have something to do: when the IRQ handler exited, the CPU went back to
perf. Eventually perf releases the CPU and our task can run. Here the cycle
started at t=93115.322925, the reply was received and the task was scheduled at
t=93115.324019 (1.1ms later). However the CPU wasn't released until
t=93115.326712, which is 3.8ms after the start, and past our 3.5ms deadline.
sched_stat_wait even tells us that the task was sitting there for 2.68ms
waiting for the CPU.
This scenario is consistent in all the traces I collected. The interrupt and the deferred tasks are handled by one particular CPU, while userspace applications are free to use any CPU they want. If our USB data happens to be delivered at a time when some user process is using the interrupt-servicing CPU, then contention and delays can result. If we increase the system CPU load, then the machine is spending more time crunching its userspace work, and interrupts are more likely to fire at an inopportune time. I.e. this is all very consistent with the observed behavior.
This feels like a fairly run-of-the-mill issue that shouldn't have been exposed
by a kernel upgrade. Why did this work on the older Linux 3.5 boxes at all? It
appears that the machines that the client is running Linux 3.13 on service the
USB interrupt on CPU 0, and this CPU may be used by any user process also. For
whatever reason, when these machines boot into Linux 3.5 instead, the USB
interrupt is serviced on CPU 12, and in practice this core is only used by the
frobnicator process. This mapping isn't enforced by any setting anywhere, but
it is what I'm observing. Perhaps there's some heuristic to put user processes
on the same CPU core that services most of the interrupts delivering that
process's data. While waiting for data, the frobnicator process spends all its
time calling read(), which in turn goes directly into the kernel. This hammering
read() behavior likely doesn't take priority over the workqueue in the kernel,
and our data can be delivered in a timely fashion. So it appears that on the
older kernel there was some sort of de-facto CPU segregation going on that
allowed the workqueue tasks to run on an uncontested CPU. I.e. we were getting
lucky.
Mitigation
We have a CPU contention issue. Potential fixes:
- Make sure the CPU servicing the interrupt is never busy when an interrupt fires
- Set up the process priorities to prioritize the workqueue above other user processes
Segregation
The older kernel effectively implements the first option above: the CPU
servicing the interrupt is never doing anything intensive, and can turn around
our data quickly. We can mimic this by using the taskset command to explicitly
set the CPU affinities of each process on the machine to stay off the CPU
servicing the USB interrupt. This CPU is controlled by the
/proc/irq/N/smp_affinity_list file where N is the IRQ number (16 on the box
the traces came from). As expected, this resolves the frobnicator performance
issues. This however is quite a big hammer: a whole CPU core becomes unavailable
for any other system work. So it's a good validation of the debugging so far,
but I want a better solution
Prioritization
As seen before, during a failure we have:
- CPU is running process
x - USB interrupt comes in
- Interrupt schedules deferred task
- Interrupt exits, scheduler runs, CPU goes back to
x
We want the scheduler to make a different choice: instead of going back to the
process that was running previously, it should service our workqueue first.
This can be done by bumping the priority of the process servicing the workqueue.
The tricky thing is that this process is not the frobnicator, but a
kworker/a:b process. As seen from the traces, on that box this process was
kworker/0:1. Setting a very high realtime priority to that process makes the
problem go away also:
$ chrt -p -r 99 $(pgrep kworker/0:1)
Something like this is a much better solution, since it doesn't sacrifice any resources, and simply prioritizes the work that has tighter timing requirements than the other tasks.
This exact command isn't a perfect final solution either, however. I don't like
touching the priority of an internal kernel process, since a later kernel change
could break the way this works. This change will have the desired effect only
if the kworker process does not change. It very well could change if the
smp_affinity_list contains multiple CPUs, or if something touches that file.
And the kworker doesn't necessary have to run on the same CPU as the
interrupt, it just happens that way; a later kernel could change that. I don't
see any kernel options to control this stuff in a better way, however. Linux 3.9
introduced higher-priority kworkers (kworker/0:1H for instance), but as far as
I can tell I'd need to patch the kernel to make the FTDI stack use them. That's
inherently maintenance-full. So in the end the recommendation was to
- disable the
irqbalancedaemon, which was setting thesmp_affinity_listas the machine was running - set the
smp_affinity_listto an arbitrary, single CPU - raise the priority of the corresponding
kworkerprocess
This seems to work. More system testing is required in case irqbalance was
actually doing something useful that people weren't aware of (this comes by
default on Ubuntu, and it's not obvious if it's a net positive or not). Any
kernel update could break something, and more testing would be required, but
that was probably assumed from the start anyway. OK. Done.